
Notes on Management Pack for SQL Server Analysis Services 2012
Apologies for the lack of snappy title! Some weeks back I posted about the Management Pack for SQL Server Analysis Services 2008 and 2012 that was recently released. If you do not know anything about the management pack I recommend a read of my older post before reading this one. We recently installed the Management Pack for SQL Server Analysis Services 2012 and as promised I am posting some notes on the whole experience and install;
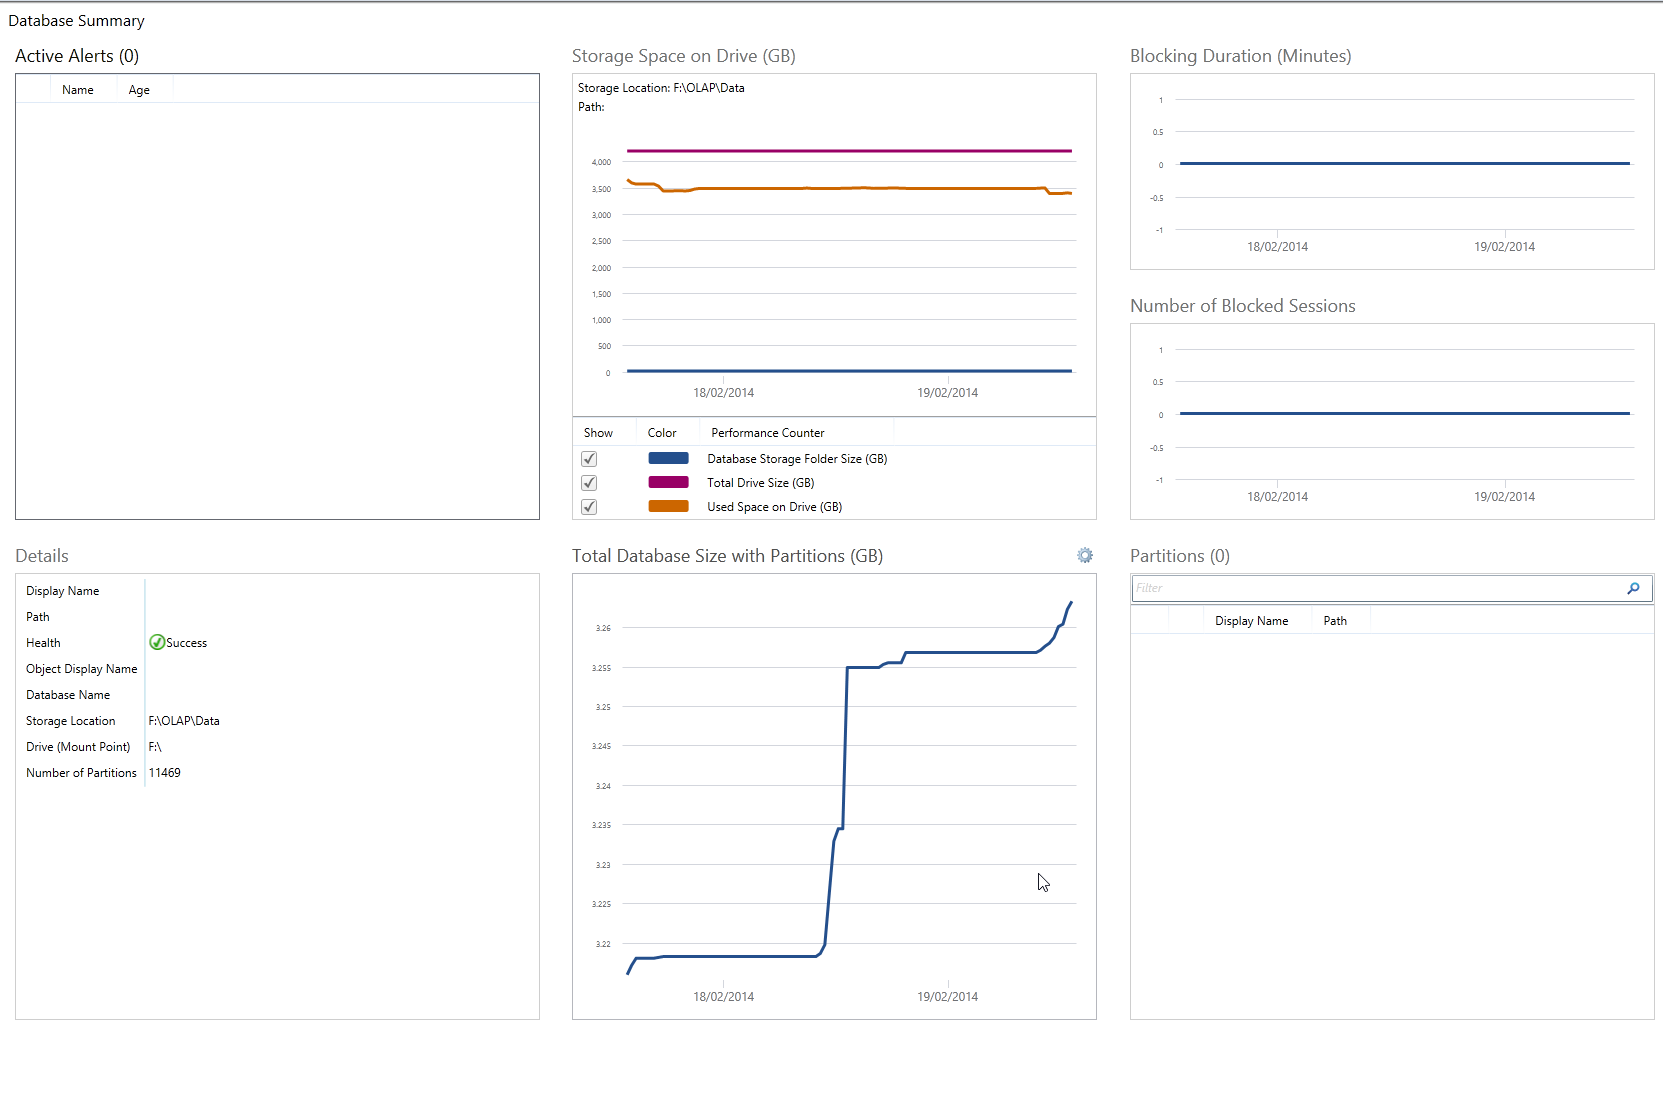
In the bottom right hand corner you can drill down into the databases hosted on that instance to check the current health (Some of the screenshot have been altered to protect sensitive information.):
Here’s a quick walkthrough of finding out what alerts are happening and how to resolve them;
an alert has appeared stating that an instance has stopped:


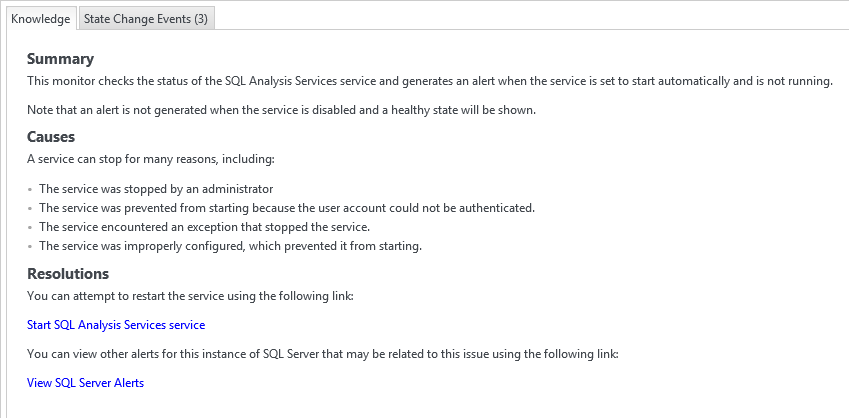
There are two tabs here: the issue and the knowledge base. So it’s almost like having the exact MSDN/TechNet article that describes what the issue is and how to resolve it right here (Some of the screenshot have been altered to protect sensitive information). This is seriously useful!
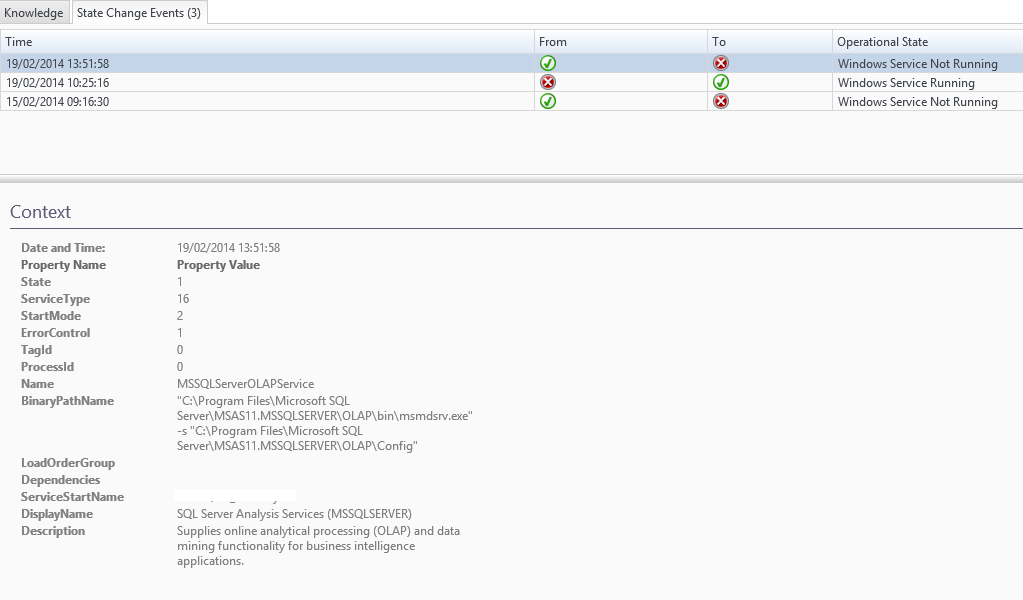
Going back to the original screen, you can right click and start the instance right here and get the feedback on the progress. This saves a lot of time and hassle.

This is quite a basic example, but I wanted to show some of the screens you’ll see and how straightforward using SCOM can be for monitoring.
Another alert that appeared today was High Memory Usage on a server.
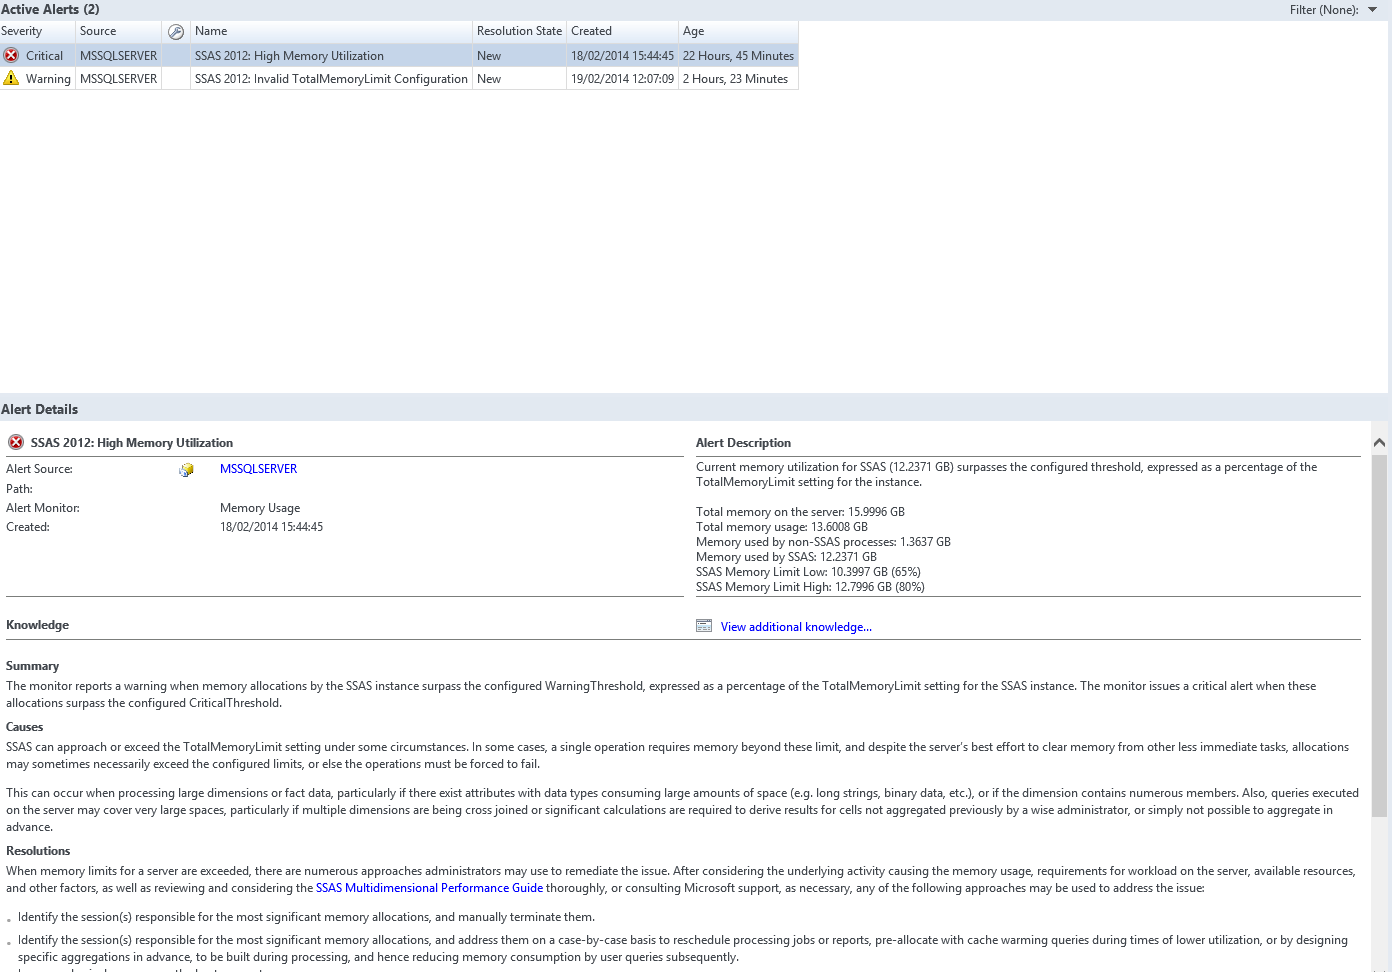
The threshold to generate this warning is a percentage of the totalMemory for the SSAS instance, which is 80% of the total memory of the server. In this case I could see that it was really close to hitting the 80% upper threshold limit that is configured by default in SSAS.

This was not leaving a lot of memory for the rest of the server. So clearly we need to do something, but what? Even if you are not experienced with SSAS there is more help for you in the Knowledge section of the alert. In the alert there was a link to the SSASPerfGuide2008.doc which had this to say on configuring memory:
Monitoring and Adjusting Server Memory
Generally, the more memory you have the better. If the data files can reside in the operating system cache, storage engine performance is very forgiving. If the formula engine can cache its results, cell values are reused rather than recomputed. During processing, not spilling results to disk also improves performance. However, be aware that Analysis Services will not use AWE memory on 32-bit systems. If your cube requires a high amount of memory, we highly recommend 64-bit hardware.
Key memory settings are Memory\TotalMemoryLimit and Memory\LowMemoryLimit and are expressed as a percentage of available memory. You can monitor memory from Task Manager or from the following the performance counters:
Before deciding that more memory is required, take the steps outlined in the querying and processing sections to optimize cube performance.
I knew that we did not use the PreAllocate setting, and I knew we were on 64 bit architecture. Despite the fact that I knew that nothing but SSAS ran on that box, the fact it was close to exceeding the upper limit meant that I could either reconfigure the warning to a higher limit, (still below 80% but higher than what it is) or I could increase the 80% limit (not a good idea as the server would be left with less than 4GB), or, like the documentation suggests, request an increase of memory for the server, which in turn will raise the threshold for maximum memory for both the alert and the instance. As this is a VM that’s simple enough to do and I’ll request an increase by 4GB to see if that resolves the error.
Or do I?
Looking at the Instance Summary Report on the SSAS Monitor I see that there has been one massive spike in memory cost, which was roughly at the same time as the alert.
If I look at the dashboards Instance Memory graph, I get a clearer view of the memory over the past 2 days.Maybe I can investigate the workload that caused the alert and anticipate it happening again before I decide to request a memory increase.
Here’s a final example: we have a server that has a total memory allocation that does not leave the server with enough memory. This is different from the error above as the 80% threshold leaves the server with less than 2GB, which is less than the minimal amount for the OS.
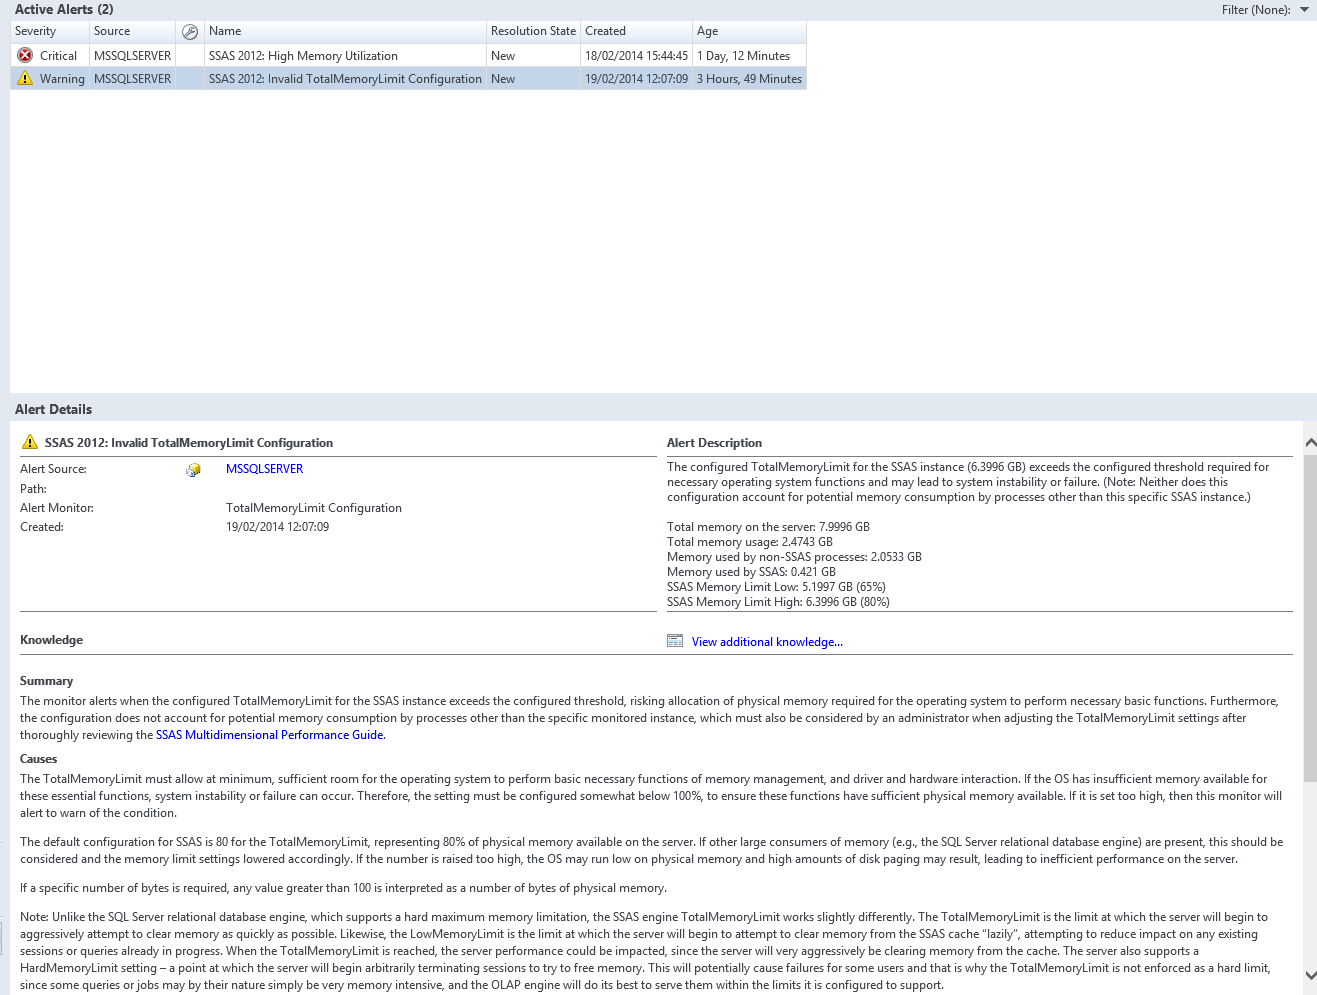
So we can either reduce the threshold for the OS from 2GB to something like 1.5 GB, but the reality is that we should reduce the SSAS Memory limits first and see if it affects the performance of the server (unlikely as the dashboard shows that it’s rarely under any stress).
 Logging onto the SSAS instance I reduced the memory limits.
 You can get the Health monitor to recalculate the health by clicking the recalculate health button
 Notice it says that the changes will not be instant but that they will come through eventually.
 Once it;s done you can go back to the monitor window to see what the status is
 But once again, there is plenty of knowledge right there to help contextualize the warning and allow you to action accordingly.
Clearly, using SCOM can help me in diagnosing issues with our instances of SSAS and pull out the performance monitors that matter the most and make decisions based on metrics rather than intuition or educated guesses. The fact that it is monitoring the services all the time means I can see any anomalies or spikes because I have baselines. The fact that so much knowledge is available to me right next to the alerts means that it is contextualized: even if I did not know anything about the service I could follow best practices, or at least check if best practices are being followed. And I’ve not even shown how to alter the rules of thresholds, or show how locked packs cannot be altered, or writing custom management packs for SSAS, or drill down deep into Entity Health to view the individual alerts or state change history (more for another time maybe)!
I’ve got a lot of time for SCOM as it’s helped me fine any potential issues and act upon them. This if course is only a small part of SCOM and what it can offer.